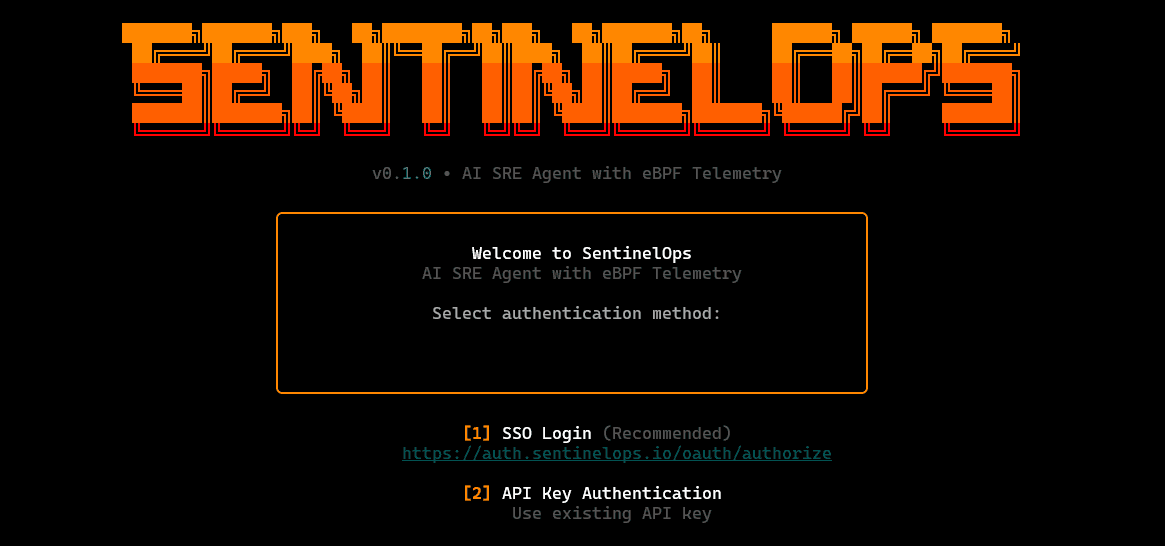
SentinelOps is an open-source CLI-first reliability tool that brings together kernel-level observability via eBPF and a structured set of SRE agents for monitoring, diagnosis, and remediation. Instead of relying on dashboards first and then switching to logs and kubectl, SentinelOps provides an interactive terminal interface where operators can inspect cluster state, trace telemetry signals, review anomalies, and run guided incident workflows from one surface.
The CLI is organized around a clear agent workflow: monitoring agents continuously scan telemetry and cluster signals for anomalous behavior, diagnosis agents perform automated root-cause analysis using the collected context, and fix agents recommend or execute remediation actions. This keeps the operational loop tight: detect → explain → act, with the supporting evidence (telemetry, logs, service topology) accessible directly through commands.
SentinelOps also supports operator interaction through natural-language queries from the terminal. Users can ask targeted questions about infrastructure state or incidents and receive actionable responses grounded in live signals and system context, rather than generic advice.
Key Features:
eBPF-powered telemetry for fine-grained kernel, network, and application signals with low overhead.
Agentic SRE workflow (monitor → diagnose → fix) instead of alert-only monitoring.
Unified loop: monitoring + diagnostics + resolution in one system, rather than switching tools mid-incident|
Features Overview:
/dashboard
Quick overview of the current environment: cluster health, active alerts, probe/agent status, and high-level system signals in one screen.
/cluster
Cluster exploration view: nodes, namespaces, workloads, pods, resource pressure, and basic runtime status checks—meant for fast situational awareness.
/servicemap
Service topology view: how services connect, where traffic flows, and which dependencies are involved—useful for narrowing blast radius during incidents.
/telemetry
Live eBPF signal view: kernel/network/application-level telemetry streams, probe status, and key events—optimized for low-overhead, high-fidelity diagnostics.
/logs [svc]
Tail and filter logs for a target service (or workload), with quick navigation and context, meant to reduce “kubectl log hunting.”
/anomalies
List detected anomalies with timestamps, severity, and the signals that triggered them, acts as the entry point for investigation workflows.
/incidents
Incident workspace: create/track active incidents, attach affected services, view timeline/context, and manage the investigation state.
/diagnose
Runs an AI-assisted diagnosis pass using available context (telemetry + cluster state + logs/service topology) and outputs likely causes plus next checks.

/fix
Guided remediation actions: proposes safe fixes and can execute selected steps, with validation/confirmation gates and clear rollback awareness.
/settings
Configuration surface: auth/profile info, target cluster context, probe/agent toggles, thresholds, and runtime preferences.
/ask <query>
Natural-language interface for infrastructure questions, grounded in live cluster/telemetry context—returns actionable answers, not generic suggestions.

As the Engineering Lead (Team Lead) for SentinelOps, I owned end-to-end technical execution—from defining the architecture and service boundaries to coordinating implementation across the team. I guided the design of the telemetry-to-action pipeline (eBPF and Kubernetes signals → processing → agent workflow), set engineering standards around reliability and security, and ensured the system remained deployable and maintainable in cloud-native environments.
⚠️ The github repo of the project will be published soon!